Step-by-step guide to getting your JavaScript debugger ready
Antechinus® JavaScript Editor runs on Windows 95, 98, NT 3, NT 4, 2000 Me, 2000 Pro, XP, Server 2003, Vista and Windows 7. The built-in JavaScript debugger has been extensively tested on Windows 2000, XP, Server 2003, Vista and Windows 7.
To enable debugging, please do the following:
 Old versions of Antechinus® JavaScript Editor do not include the script debugger. If you have not already done so, click here to download and install the latest version, with the number-one, professional JavaScript debugger. Old versions of Antechinus® JavaScript Editor do not include the script debugger. If you have not already done so, click here to download and install the latest version, with the number-one, professional JavaScript debugger.
 Make sure you have administrator privileges. Make sure you have administrator privileges.
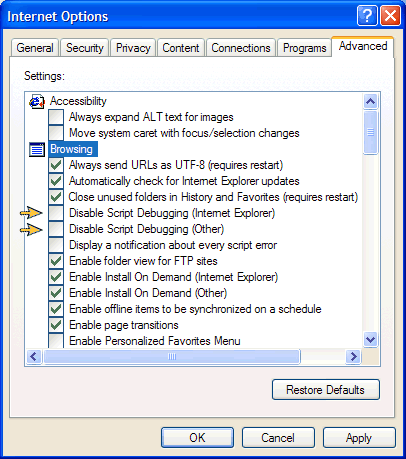
 Make sure debugging is not disabled: run Internet Explorer and select Tools / Internet Options / Advanced tab. Un-check both Disable Script Debugging (Internet Explorer) and Disable Script Debugging (Other): Make sure debugging is not disabled: run Internet Explorer and select Tools / Internet Options / Advanced tab. Un-check both Disable Script Debugging (Internet Explorer) and Disable Script Debugging (Other):

 Click here to complete the 10-minute step-by-step guide to learn how to debug your web applications in record time. Click here to complete the 10-minute step-by-step guide to learn how to debug your web applications in record time.
Troubleshooting
If you have administrator privileges and debugging is not disabled, and JavaScript Editor's debugger is still not working, this means that your Windows installation does not have Active Script Debugging in place. Active Script Debugging is included with any of the following:
 Microsoft Office Microsoft Office
 Microsoft Visual Studio Microsoft Visual Studio
 IIS - Internet Information Server IIS - Internet Information Server
 PWS - Personal Web Server PWS - Personal Web Server
 Remote Components Setup Remote Components Setup
 Platform SDK Platform SDK
 Microsoft Script Debugger Microsoft Script Debugger
If in doubt, or if you get the error message "class not registered" when you start debugging, go for the Microsoft Script Debugger download. It is free, and it installs Active Script Debugging:
 Do a Google search below for MS Script Debugger. This takes you directly to the free JavaScript debugger download page on the Microsoft site. Download it and install it. Do a Google search below for MS Script Debugger. This takes you directly to the free JavaScript debugger download page on the Microsoft site. Download it and install it.
 Launch Antechinus® JavaScript Editor and complete the tutorial - it guides you step-by-step from the essentials to advanced use of the built-in professional JavaScript debugger. After that, you'll find debugging web applications literally effortless. Launch Antechinus® JavaScript Editor and complete the tutorial - it guides you step-by-step from the essentials to advanced use of the built-in professional JavaScript debugger. After that, you'll find debugging web applications literally effortless.
|

